



October 9, 2026
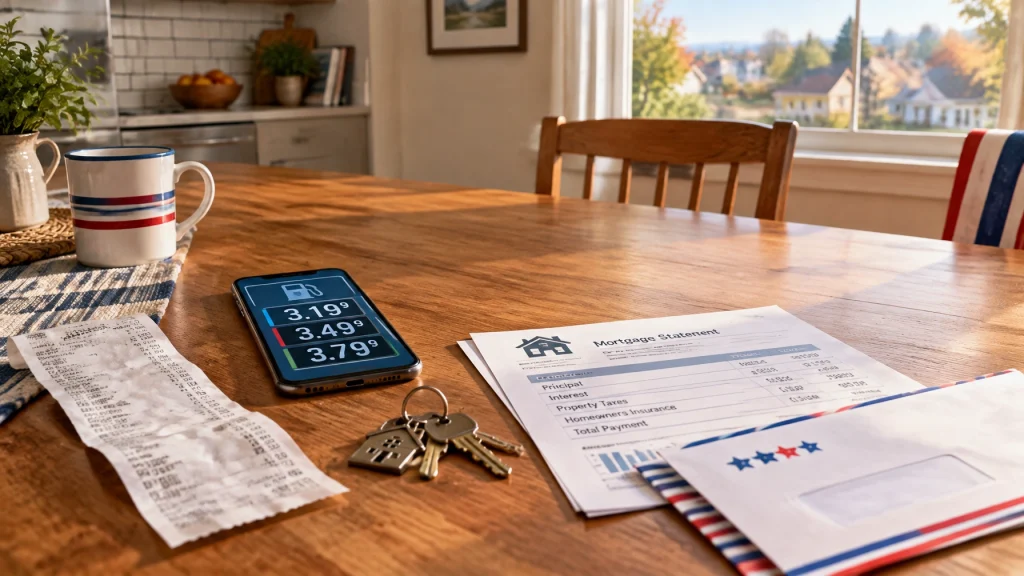
The economy is not a single number. It is the price at the gas station, the balance on the credit-card statement, the rent or mortgage payment, and the answer to a simple question: “Can I find a better job if I need one?”
That is the economic scorecard voters will carry into the November 3 midterm election.
The national data tell a mixed story. Hiring has slowed, inflation remains uncomfortable, borrowing costs are high, and household budgets are still absorbing the effects of the Iran war and its impact on energy prices. At the same time, layoffs remain low, most people still have jobs, financial markets are near records, and some major economic measures look stable by historical standards.
There is no requirement to turn that mixed picture into a partisan verdict. The useful exercise is to lay out the categories and let voters decide which ones matter most.
1. Jobs: secure if you have one, difficult if you need one
The unemployment rate has ticked up to 4.2%, while the economy has added only about 40,000 jobs per month over the past 12 months. That is a very slow pace compared with the hiring boom that followed the pandemic.
The latest monthly report showed only about 29,000 new jobs, a number small enough to feel more like a rounding error than a recovery. Reporting has connected the slowdown to economic strains from the Iran war and immigration enforcement, both of which have affected business confidence, labor supply, and operating costs.
The important detail is that the labor market is not collapsing. Initial jobless claims are around 197,000, and Challenger reported 43,281 announced job cuts in September. Those are relatively low layoff numbers.
That creates an unusual labor market:
- Most people who have jobs are still holding onto them.
- Employers are reluctant to make large layoffs.
- Workers are reluctant to quit without another job lined up.
- Job seekers can wait weeks or months for an offer.
The kitchen-table translation is straightforward: job security may still be decent, but job mobility is not. A person with a paycheck may feel fine. A person searching for a paycheck may feel that the economy has already entered a recession.
The Bureau of Labor Statistics employment report provides the official labor-market data behind that distinction.

2. Gas: the most visible economic headline
The national average gasoline price is about $4.36 per gallon. That is down from the war peak of $4.56, but it is still 48% higher than at the end of February.
Gasoline is politically powerful because it is both unavoidable and visible. Consumers do not need an economics degree to know whether a fill-up costs $45 or $75. The price appears on a large sign beside the road, and the household budget feels it immediately.
The Iran war has pushed energy markets higher, particularly because the Strait of Hormuz is a critical shipping route. Before the conflict, roughly 20% of the world’s petroleum passed through the strait. A disruption does not have to shut the route completely to create fear, higher insurance costs, longer shipping times, and a risk premium in oil prices.
A president can release petroleum from the Strategic Petroleum Reserve, encourage domestic production, negotiate internationally, or attempt to influence expectations. But no president can simply order the global oil market to lower its price. The United States is part of a worldwide energy system, and crude oil is priced globally.
For voters, the distinction between controllable and uncontrollable may matter less than the number on the pump. That is not irrational. Household budgets respond to prices first and explanations second.
3. Groceries: inflation has slowed, but the old prices remain
Food at home was up 2.2% year over year as of August. That sounds manageable compared with the much faster inflation of recent years. But a slower rate of increase is not the same as a return to old prices.
If a grocery bill rose from $100 to $120 during the inflation surge, a 2.2% increase means the next bill is roughly $122.64. It does not mean the bill returns to $100.
Some categories remain particularly painful. Candy prices were up 8.1% year over year in August, just in time for Halloween. Diesel-driven freight costs are also still working through the supply chain. Transportation affects food, packaging, inventory, and delivery costs, often with a delay between the original fuel shock and the final shelf price.
This is why inflation can feel worse than the headline number. Official averages cover thousands of goods and services. A household does not purchase the average basket. It buys the specific basket that happens to matter that week.
4. Borrowing costs: the monthly payment is the message
The Federal Reserve raised interest rates in September, its first increase since July 2023. Sixteen of the 18 policymakers projected at least one more increase this year, and officials do not expect inflation to return to the Fed’s 2% target until 2029.
For regular households, the policy debate becomes concrete through monthly payments:
- Mortgage rates are around 7%.
- Credit-card rates are above 20%.
- Car loans remain expensive.
- Savings accounts and certificates of deposit pay more than they did several years ago, but not every household has enough cash to benefit.
Higher rates are intended to slow demand and make it harder for inflation to continue. That can eventually help prices stabilize, but the medicine is unpleasant. A family delaying a home purchase does not experience “reduced aggregate demand.” It experiences a payment that no longer fits the budget.
This is one reason voters may grade the economy more harshly than a financial-market investor does. A higher interest rate can help a saver while hurting a borrower. The same policy produces different report cards at different kitchen tables.
5. Income: the paycheck is rising, but purchasing power is not
Nominal wage growth is running around 3.2% to 3.5%. That sounds positive until it is compared with the prices people actually face.
When wage growth trails inflation, real income falls. The paycheck contains more dollars, but those dollars purchase less. Real earnings turned negative in the second quarter for the first time since 2022.
That helps explain the gap between official economic language and household sentiment. “Wages are up” can be true. “Workers are falling behind” can also be true.
The answer depends on which number is being measured:
- The paycheck before inflation is nominal income.
- The paycheck after inflation is real income.
- The household experience depends on whether its personal expenses are rising faster or slower than the official inflation measure.
A family facing higher rent, gasoline, insurance, and groceries may feel poorer even if its annual raise looks respectable on paper.
6. Housing: prices are softer in real terms, payments are still brutal
The Freddie Mac House Price Index rose 2.2% year over year in August, slower than inflation. In real terms, that means home prices are declining.
That sounds like relief for buyers, but the monthly payment is what matters. A slightly slower home-price increase does not offset a mortgage rate near 7%. Buyers must still contend with the interest rate, property taxes, insurance, maintenance, and a large down payment.
Existing homeowners may benefit from having locked in cheaper mortgages, but that benefit comes with a trap: selling means giving up the old rate and financing the next house at today’s rate. A household can feel wealthy on paper and stuck in place financially.
Housing therefore divides the public into different groups:
- Owners with low-rate mortgages may feel protected.
- First-time buyers may feel priced out.
- Renters may face pressure from limited supply and high operating costs.
- Sellers may have equity but hesitate to move.
One national housing number cannot capture all four experiences.

7. Wealth: the top half is doing fine
Financial markets are near record levels. That improves retirement accounts, raises household net worth, and makes the aggregate economy look healthier.
But the benefits are unevenly distributed. The top half of the K-shaped economy owns more stocks, more real estate, and more businesses. Those households can feel resilient even when prices rise.
The lower half often has more exposure to wages, rent, food, gasoline, and credit-card balances. It may own fewer appreciating assets and have less ability to absorb a surprise bill.
This is the central reason the headline economy and the lived economy can diverge. The aggregate numbers are not necessarily wrong. They are simply averages. Averages can hide distribution.
A rising stock market can coexist with a household that is skipping restaurant meals. A low layoff rate can coexist with a worker who has submitted 40 applications without receiving an offer. A 2.2% increase in home prices can coexist with a buyer who cannot qualify for the monthly payment.
That is not cynicism. It is arithmetic.
The “vibes” question is really a distribution question
When voters say the economy feels bad, they are often describing a combination of prices, uncertainty, and unequal exposure.
Some households are protected by a fixed mortgage, a strong retirement account, or a secure professional job. Others are exposed to rent increases, variable-rate debt, gasoline prices, and weaker hiring.
Partisanship also filters the data. Supporters of the governing party are more likely to notice favorable indicators. Opponents are more likely to notice the costs. That happens in both directions and under every administration. The same jobs report can be read as evidence of resilience or evidence of deterioration depending on the reader’s prior political view.
That does not make the numbers meaningless. It means voters combine data with personal experience. A person does not vote on GDP in the abstract. A person votes after opening the electric bill, filling the gas tank, checking the grocery receipt, and deciding whether a job change is safe.
Historically, midterm elections tend to turn more on pocketbook sentiment than on headline GDP. Voters reward the economy they feel, not necessarily the economy described in a national press release.
What could change the scorecard before November 3?
Three developments deserve attention in the final weeks:
- Gas prices: A further decline would provide immediate household relief. Another energy shock would dominate the economic conversation.
- The October 14 CPI report: This will show whether inflation is cooling, reaccelerating, or remaining stuck in the uncomfortable middle.
- The October 27–28 Federal Reserve meeting: The Fed’s decision and language will shape expectations for credit cards, mortgages, business investment, and future employment.
The final grade is not being assigned here. The scorecard is more useful than a verdict.
Jobs are stable for many people but weak for job seekers. Gasoline is below its peak but far above its winter price. Grocery inflation has slowed while grocery bills remain elevated. Wages are rising in nominal terms but losing ground in real terms. Housing prices are softening in inflation-adjusted terms while borrowing costs remain painful. Markets are strong, but wealth gains are not evenly shared.
Those are the facts. The judgment belongs to the voter.
Be mindful, be watchful and good luck.
Educational disclaimer: This article is for general informational and educational purposes only. It is not investment, financial, tax, legal, or political advice. Economic conditions and market data can change, and readers should consult a qualified professional before making financial or investment decisions.