



If you’ve spent five minutes on social media or talked to your neighbor over the fence lately, you’ve heard the same song: “Everything is too expensive, I’m tapped out, and I’m one flat tire away from financial ruin.”
On the surface, the numbers back you up. A recent Gallup survey found that a staggering two-thirds of Americans claim that rising fuel costs are causing their household genuine financial hardship. That’s not just "annoyance" at the pump; that’s "I’m choosing between a full tank and a full fridge" territory. People are stressed, they’re vocal, and they’re telling anyone who will listen that they are broke.
But then, the Bank of America (BofA) card-spending data drops, and it tells a completely different story. According to their internal tracking, non-gas spending: the stuff you choose to buy, not the stuff you have to buy: is hovering near its strongest levels in three or four years.
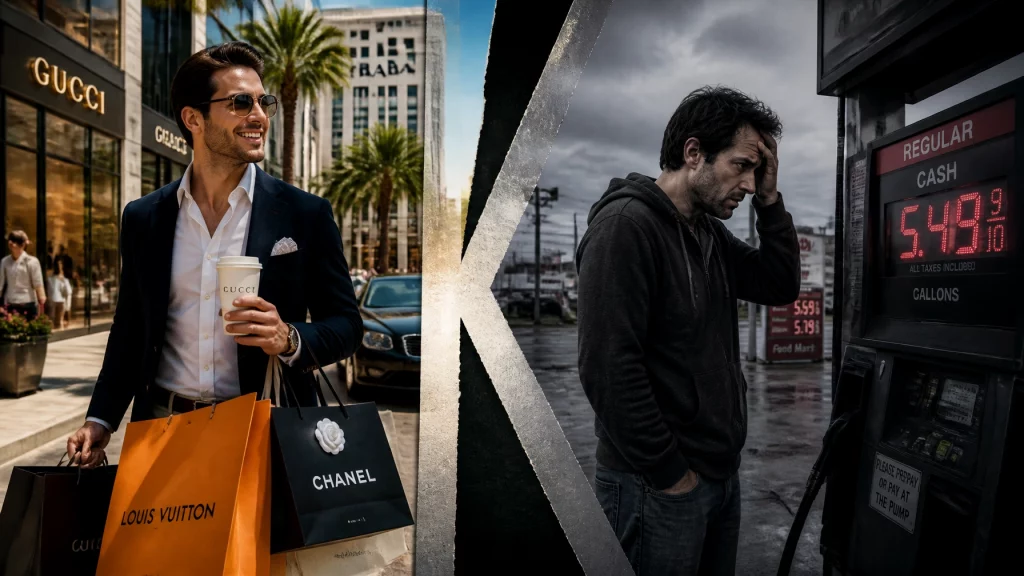
So, what gives? Is everyone a liar, or is the data broken? The answer is neither. We are living through the most aggressive "K-shaped" economy in modern history, where the "I'm fine" crowd and the "I'm drowning" crowd are living in two entirely different Americas while using the same currency.
The Gallup Reality: The "I'm Drowning" Crowd
Let’s start with the hardship. When 66% of people tell a pollster they are hurting, you have to believe them. We see it every day in the Regular Guy Economics podcast. The cost of living isn't just a headline; it's a grind.

When gas prices stay elevated, they act like a regressive tax. If you make $40,000 a year and spend $300 a month on gas just to get to work, that’s a massive chunk of your disposable income gone. You aren't "choosing" to spend that money; the economy is extorting it from you so you can keep your job.
This is the crowd that Gallup is capturing: the people for whom the margin of error in their monthly budget has evaporated. These are the people shifting to private-label cereal and praying their car’s alternator holds out for another six months.
The BofA Data: The "I'm Fine" Crowd
Now, look at the other side of the coin. If everyone is so broke, why are the restaurants full? Why is the Bank of America data showing robust spending on travel, entertainment, and "non-essentials"?
The BofA data doesn't care about your feelings; it only cares about your swipes. And the swipes are happening. This is where the top 20–30% of earners come into play. For a household making $250,000 a year, gas going up a dollar a gallon is an annoyance, but it doesn't stop the summer trip to Europe or the upgrade to the new iPhone.

Because this group has a disproportionate amount of the total spending power, their "business as usual" behavior masks the pain felt by everyone else. When BofA averages the data, the guy buying a $12 craft cocktail balances out the person skipping lunch to save $12. The data looks "strong," but it's a mathematical illusion that ignores the human cost on the lower half of the K.
The Albertsons Warning: Where the Rubber Meets the Road
If you want to know who is winning the argument between the Gallup survey and the BofA data, look at the retailers. Albertsons just cut its 2026 outlook, specifically citing a "consumer pullback."
When a massive grocery chain: a place where people buy necessities: starts sounding the alarm, you should pay attention. Grocers are the "canary in the coal mine." You can fake a lifestyle on a credit card for a while (which might be inflating that BofA data), but you eventually have to face reality at the checkout counter.
Albertsons is seeing customers trade down. They’re seeing smaller baskets. They’re seeing the "Regular Guy" finally hit the wall. It’s a signal that the "Funflation" we’ve been seeing: where people keep spending even though they’re broke: is finally meeting the cold, hard reality of an empty bank account.
The K-Shaped Divide: Two Americas, One Statistic
The gap between what people say and what they swipe isn't a contradiction: it’s a map of a fractured society.

On the upper arm of the "K," you have people whose assets (homes, stocks, 401ks) have ballooned in value. They feel wealthy, so they spend. On the lower arm of the "K," you have people who rent their homes, drive older cars, and have zero exposure to the booming stock market. For them, every tick up in the CPI is a direct hit to their quality of life.
When the media says "The consumer is resilient," they are looking at the average. But as we always say here, if you have one hand in a bucket of ice and the other on a hot stove, on "average" you're comfortable: but in reality, you're in a hell of a lot of pain.
Which One Are You?
The reality of the 2026 economy is that your "vibe" depends entirely on your balance sheet. If you feel like everyone else is crazy for spending money while you’re struggling to buy eggs, you aren't crazy. You’re just on the wrong side of the K.
The danger is when the "I'm fine" crowd stops spending because they finally get spooked. When the top of the K starts to dip, that’s when the "Regular Guy" really needs to watch out. Because if the people with money stop swiping, the jobs for the people without money start disappearing.
We’re in a weird, precarious moment where the data says "boom" but the gut says "bust." Our advice? Don’t trust the averages. Look at your own ledger, ignore the "funflation" noise, and realize that just because the person in front of you is swiping a gold card doesn't mean the economy is healthy. It just means they haven't hit their limit yet.
Be mindful, be watchful and good luck.