



November 12, 2026
The government can tell you that consumer prices rose 0.4% in October. It cannot give you the normal year-over-year inflation rate for that month.
That sounds like a strange distinction, but it matters. The missing number is not the result of a mystery at the grocery store or a secret formula locked in a basement. The Bureau of Labor Statistics (BLS) is missing a reliable comparison point: the price data it would normally use from October last year.
Economists have reconstructed an annual estimate of about 4%. It’s useful context, but it isn’t an official BLS figure. In other words, the inflation conversation is going on, but one of the measuring tools is out of order.
How a year-over-year inflation rate works
Think of a price index as a running scoreboard for the prices of a large basket of goods and services. The BLS collects prices across the country, weights categories based on what households buy, and calculates the Consumer Price Index, or CPI.
To calculate year-over-year inflation, compare the index this October with the index last October:
This October’s index ÷ last October’s index − 1 = year-over-year inflation.
If the index were 320 this October and 308 last October, the increase would be about 3.9%. The actual CPI index uses its own scale, but the kitchen-table math is the same: today’s price level compared with the same point a year ago.
The problem is that the government shutdown last October halted BLS data collection. For many price series, the agency lacks the normal, directly observed October 2025 comparison. Some values may have been carried forward or otherwise estimated; that is not the same as collecting prices in stores and surveying housing costs at the time.
So the standard October-to-October calculation can’t be made reliably for the overall index. The BLS explanation of the shutdown’s effect on CPI lays out how the lapse in data collection affected the report.

What we have instead
The monthly number is available: CPI rose 0.4% in October, seasonally adjusted. That calculation compares October with September, when the agency had usable data. It’s a real monthly reading, and it was higher than the 0.3% increase economists had expected, according to CNBC’s coverage of the October CPI report.
The monthly change can be turned into a rough annual pace. If prices rose 0.4% every month for 12 months, the compounded increase would be about 4.9%. But that is an illustration, not a forecast. One month can be unusually hot or unusually cool, and it does not tell us what every following month will bring.
Economists have used partial data, other price sources and statistical methods to fill in the missing comparison. Those reconstructions point to inflation of around 4%. Some estimates are a little lower. The number is informative, but it comes with assumptions. It is an estimate with uncertainty around it, not a published BLS year-over-year statistic.
That distinction matters because inflation figures usually arrive with an official method and a consistent data trail. There isn’t one official confidence interval attached to this reconstructed “about 4%.” The missing month adds uncertainty on top of the ordinary challenges of measuring millions of changing prices.
The grocery receipt tells its own story
For households, the average can feel a long way from the checkout line.
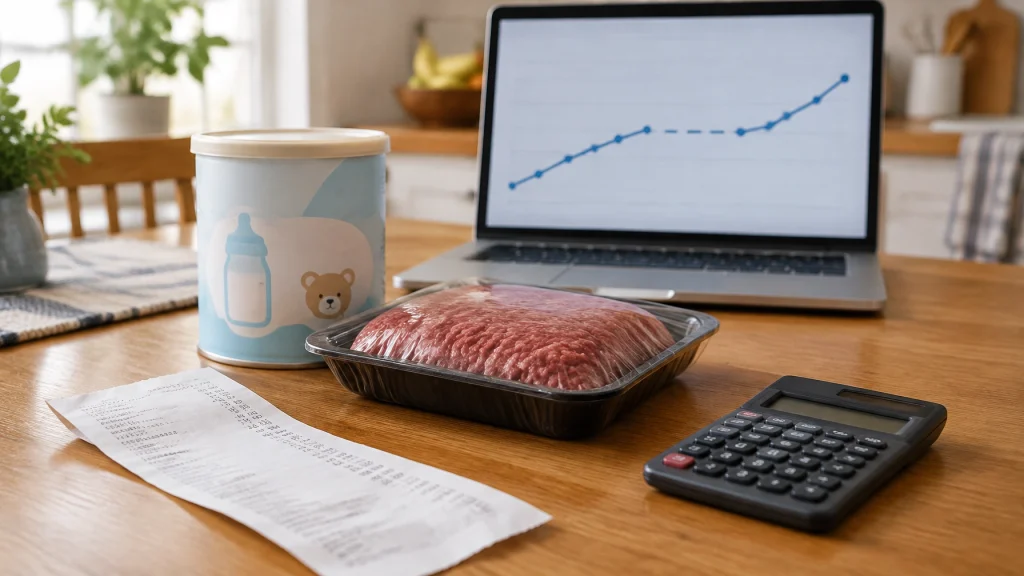
Food prices rose 0.5% in October. The BLS reported that its baby food and formula category jumped 5.1% in a month, the largest monthly increase ever recorded for that category. Beef rose 0.9%.
That 5.1% is a change in the BLS category index, not a guarantee that every brand or store raised its price by exactly that amount. Still, it describes a sharp move in a category that many parents cannot easily avoid.
Formula is a particularly tough household expense. A family with an infant can’t simply decide to wait a few months before buying it. There may be limits to switching brands, and shopping around takes time and depends on what is in stock. In economic language, demand for a necessary product like formula is relatively inelastic: higher prices don’t give families much room to cut back.

Beef’s 0.9% monthly increase lands on top of earlier price rises, as do increases across the food basket. Even if prices stop climbing quickly, they don’t automatically return to where they were several years ago. That’s the difference between the inflation rate (how fast prices are changing) and the price level: what things cost now.
If prices rose 8% one year and then 3% the next, inflation has slowed. But the second year’s prices are still rising from the already higher level created by the first year. A slower climb is not a trip back downhill.
Why the missing number matters to the Fed
The Federal Reserve sets interest rates while watching a collection of economic measures. It does not set policy using CPI alone: its formal inflation goal is tied to the Personal Consumption Expenditures price index. But CPI is one of the most closely watched readings, and October’s report arrives while officials are weighing their next move.
A report showing a 0.4% monthly increase gives rate-hike advocates something to point to. If that pace continued, it would add up to nearly 5% inflation over a year. Meanwhile, the missing year-over-year comparison gives people who favor patience a reasonable caution: the usual annual figure is not available, and a single month is not a trend.
That’s not an argument that the Fed should ignore the data. It’s an argument to understand what the data can and cannot say. The measurement has a hole in it, and monetary policy still has to be made.
There is an important counterweight here: the true annual rate could be above or below 4%. Reconstructing a missing comparison is an attempt to make the best of incomplete evidence, not a way to recover certainty after the fact. And one monthly report can move around because of temporary changes in energy, travel or other categories.
The BLS October CPI release publishes the figures the agency could support and explains why it did not provide the normal annual comparison. That is the responsible choice. A statistical agency should report what it can verify and label what it can’t, not guess to satisfy a headline.
Statistics are infrastructure
We tend to treat public statistics as if they simply appear on schedule. They don’t. They are built from people collecting prices, businesses and households answering surveys, staff checking the results, and funding that keeps the process running.
When the government shuts down, some of that machinery stops. The data gap remains even after offices reopen, because you can’t go back in time and collect a price survey that was never done. The arguments about inflation, meanwhile, carry right on, often louder than before.
That is the bigger lesson in this October report. The 0.4% monthly increase is available. The roughly 4% annual estimate is a useful reconstruction. Neither should be confused with a normal, observed year-over-year CPI reading. A missing measurement doesn’t make the cost of groceries imaginary. It does mean everyone should be careful about claiming more certainty than the evidence supports.
Be mindful, be watchful and good luck.
Disclaimer: This article is for educational and informational purposes only and is not investment advice. Economic conditions and interest-rate decisions can affect financial choices differently for each person. Talk with a qualified financial professional before making investment or other money decisions.