



October 30, 2026
A quick correction to the headline’s setup: on October 23, the S&P 500 did not finish up, and Nvidia did not rally. The index fell about 0.5%, while roughly three out of four S&P 500 stocks declined. Nvidia was also down. But the index’s drop was much smaller than the number of falling stocks might suggest. That gap is the story: a stock index can tell you how a portfolio weighted by company size performed, not how the typical stock performed. (AP News)
The S&P 500 is not a vote
The S&P 500 is a capitalization-weighted index. In plain English, a company gets more influence when its publicly tradeable market value is larger.
The basic calculation is:
A company’s index weight = its market value available to public investors ÷ the combined market value of the index.
That last detail matters. The index uses float-adjusted market capitalization, which accounts for shares available to public investors rather than simply counting every share a company has ever issued. The S&P Dow Jones Indices methodology describes the rules behind the calculation.
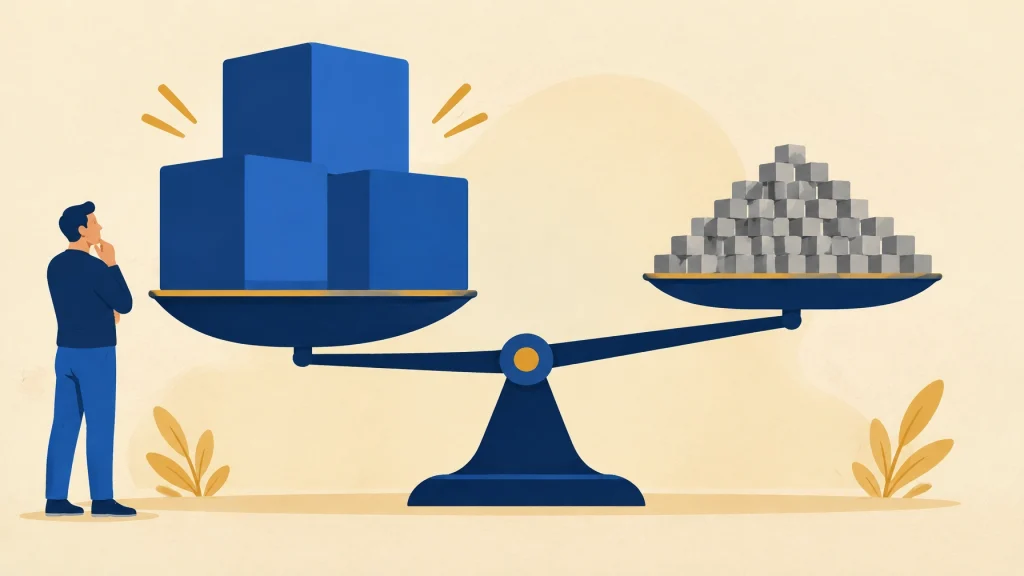
So, the S&P 500 is not a roll call in which every company gets one equal vote. It is closer to a town meeting where the biggest companies are handed the loudest microphones.
When Microsoft, Apple, Nvidia or another mega-company moves, it can have more effect on the index than dozens of smaller companies combined. That’s why the S&P 500’s headline number can look calm while most of its members are having a rough day.
A kitchen-table example
Suppose a giant company makes up 7% of an index and its shares rise 3%. Its contribution to the index is roughly:
7% × 3% = 0.21 percentage points.
Now imagine 100 smaller companies each make up 0.2% of the index and fall an average of 1%. Together, their effect is roughly:
100 × 0.2% × −1% = −0.20 percentage points.
Those two forces nearly cancel. The index might look almost flat even though all 100 smaller stocks fell. The index is reporting a weighted average; it is not claiming that most stocks went up.
This is a simplified example, not a reconstruction of October 23. Real index weights differ, and every company’s daily move contributes to the total. But it shows the mechanism: index weight multiplied by stock return. A small move in a very large company can matter more than a larger move in a much smaller one.
On October 23, about 134 of the S&P 500’s 500 constituents rose. That means the index’s roughly half-percent decline understated how widespread the losses were. The actual index was down, but it fell less than the typical stock’s experience might lead you to expect. (AP News)
“I own 500 companies”: yes, but not equally
A plain S&P 500 index fund in a 401(k) can be a useful way to own slices of many large U.S. companies. But owning 500 names does not mean putting one five-hundredth of your money in each.
By year-end 2025, RBC Wealth Management’s analysis put the ten largest companies at about 40.7% of the S&P 500’s total weight. In kitchen-table terms, roughly 40 cents of every dollar tracking that index was tied to its ten largest companies. The exact percentage varies with market movements and measurement dates, but the broader point is clear: the index has become unusually top-heavy. (RBC Wealth Management)

That doesn’t mean the other 490 companies are imaginary, or that an S&P 500 fund is secretly just ten stocks. It does mean the fund’s results can depend heavily on a small group of giant companies. You own 500 companies, but the biggest holdings get the biggest share of your investment. The rest form a much smaller tail.
That’s still diversification across companies. It is simply less evenly spread than the number “500” may suggest. And when the giants are concentrated in related industries or themes, the fund can also be more exposed to those forces than its label implies.
The equal-weight version makes the difference visible
There is another version of the index: the S&P 500 Equal Weight Index. Instead of giving each company a share based on market value, it targets roughly 0.2% per company at each quarterly rebalance. In other words, the very largest company and a much smaller S&P 500 company start that period with similar weight. (S&P 500 Equal Weight Index)

The two indexes contain essentially the same companies but answer different questions. The standard S&P 500 asks, “How did these companies perform when weighted by their market size?” The equal-weight version asks, “How did they perform when each company had a similar starting weight?”
When the biggest companies surge, the standard index can pull ahead. When smaller companies do better, equal weighting can benefit. Their performance can diverge sharply, which makes the comparison a useful way to see the effect of concentration. It is a different weighting method, not a recommendation to buy one fund over another.
Concentration is old news, but never a free pass
Market leadership has narrowed before. During the Nifty Fifty era of the early 1970s, investors treated a group of large growth companies as exceptionally dependable. Many were strong businesses. But their share prices reflected very optimistic expectations, and when those expectations changed, investors could still lose a great deal.
The dot-com boom offers another reminder. By the end of 2000, the ten largest S&P 500 companies represented about 23% of the index, according to RBC’s historical analysis. The technology sell-off that followed hit the largest names hard. It would be wrong to say the broader market simply breezed through that period: many stocks fell. But the index’s biggest companies and their valuations were a major part of the trouble, and equal-weighted stocks later outperformed as leadership shifted. (RBC Wealth Management)
The lesson isn’t that today’s largest companies are bad businesses. It’s that a good company and a good price are not the same thing. A stock price also reflects what investors expect the company to deliver. When those expectations leave no room for a stumble, even a successful business can disappoint the market.
The index is carrying an AI bet
Today’s biggest S&P 500 companies are closely connected to technology and artificial intelligence. That links index performance to a shared question: will the enormous spending on AI equipment, data centers and related infrastructure produce the growth investors expect?
The St. Louis Fed estimated that AI-sensitive investment categories contributed about 39% of U.S. real GDP growth in the first three quarters of 2025. That’s an estimate based on investment categories such as equipment, software, research and data centers, not a claim that a defined group of AI companies produced 39% of GDP growth. The distinction matters, but the figure helps show why AI spending has become economically important. (St. Louis Fed)
When investors get nervous about AI spending or the cost of financing it, the index can feel the wobble because its largest companies carry so much weight. And when those giants rally, they can make the headline index look healthier than many of its members. That’s the index math at work, not a trick, but a useful reminder to look beyond one number.

For another plain-English look at markets and the economy, explore Regular Guy Economics’ general articles.
The easy explanation to pass along: the S&P 500 is weighted by company size, so its biggest members have the biggest effect. The index can be flat or slightly up when most stocks fall, or it can drop sharply when a handful of giants struggle. Both the index and the broader market are real; they’re just measuring different things.
Be mindful, be watchful and good luck.
Educational disclaimer: This article is for general informational and educational purposes only. It is not investment advice or a recommendation to buy or sell any security. Consider speaking with a qualified financial professional about decisions affecting your situation.