



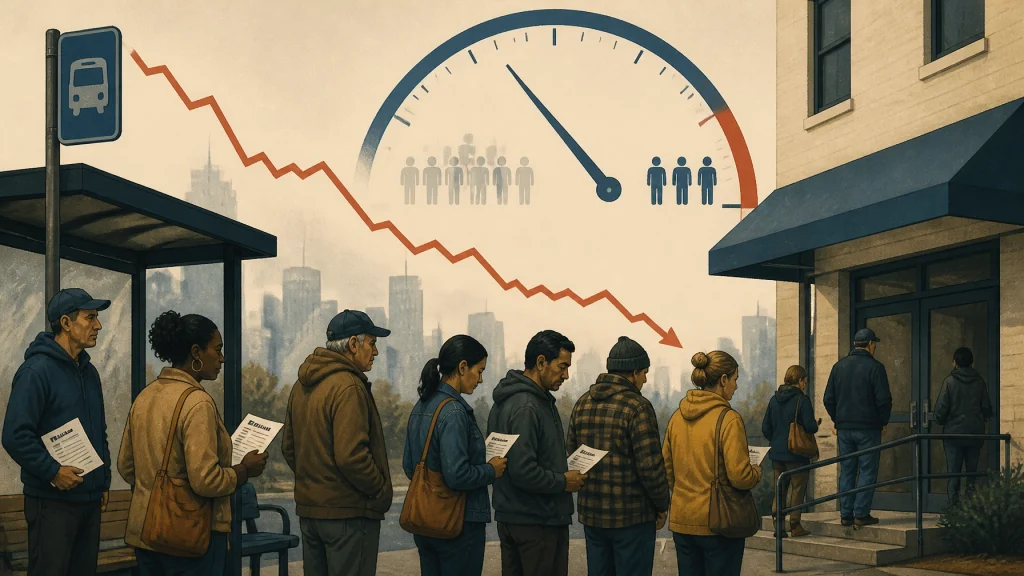
There are good ways for unemployment to fall.
One is that employers hire more people, pay decent wages, and give workers enough confidence to keep looking for jobs. The other is that people stop looking altogether.
July’s unemployment report looks much more like the second kind.
The unemployment rate slipped from 4.2% to 4.1%. That is the number that will make the headlines, appear in market updates, and produce a few cheerful statements from people who do not have to submit job applications for a living.
But the labor force shrank by approximately 264,000 people. The labor force participation rate fell to 61.4%, its lowest level since early 2021. Meanwhile, payroll employment declined by 23,000 jobs.
That is not a booming labor market. That is a smaller pool of people being counted.
The Bureau of Labor Statistics July employment report contains the details. The headline says unemployment fell. The underlying numbers say fewer people were working or actively looking for work.
Those are very different stories.
The statistical trick is not really a trick
The unemployment rate is calculated as the number of unemployed people divided by the labor force.
The labor force includes:
- People who are employed
- People who are unemployed but actively looking for work
It does not include people who have stopped looking.
That last category matters. If 100 people are unemployed and 10 of them give up searching, the number of unemployed falls to 90. If the labor force also falls, the unemployment rate can improve even though the economy did not create a single new job.
The scoreboard looks better because some players left the stadium.

That is essentially the problem with celebrating July’s 4.1% rate without discussing participation. A lower unemployment rate caused by stronger hiring is encouraging. A lower rate caused by a shrinking labor force is a warning that the labor market may be losing energy.
This is why the BLS labor force statistics deserve at least as much attention as the headline unemployment number.
What happened to the missing workers?
People leave the labor force for many reasons.
Some retire. Some return to school. Some become caregivers. Some become discouraged after months of rejection. Others may be sick, disabled, or unable to find work that fits around child care and transportation.
The statistics do not automatically tell us which explanation dominates in any given month. That is why it is important not to overstate the case. A decline in participation is not proof that hundreds of thousands of people permanently gave up.
But it is still economically meaningful.
A healthy labor market should generally make it worthwhile for people to work or search for work. If participation is falling while payroll employment is declining, the public is entitled to ask whether the available jobs are attractive enough, plentiful enough, or well-paid enough to bring people back.
“People are not unemployed because they are no longer looking” is not the same thing as “people are doing fine.”
Payrolls and real employment are telling different stories
There is another wrinkle hiding underneath the July report: the difference between payroll jobs and people employed.
The payroll survey counts jobs reported by employers. It is useful, broad, and closely watched. But it does not fully capture self-employed workers, independent contractors, certain gig workers, or people operating outside the traditional employer payroll system.
The household survey, by contrast, counts people and includes self-employment. That means the two surveys can tell different stories without either one being automatically wrong.
The current comparison is particularly striking. Payroll jobs are up approximately 266,000 since January, while total employment: including self-employment: is down roughly 920,000 over the same period.
That is not a small disagreement. It is a flashing yellow light.

The surveys use different methods, samples, and definitions. Month-to-month noise can be substantial. But when payrolls, household employment, participation, and job openings are all moving in different directions, the appropriate response is not to pick the most flattering number and declare victory.
The appropriate response is to investigate.
For the regular person, the distinction is simple: a business can report a payroll job while the broader economy still has fewer people working. A contractor can lose assignments without appearing in a traditional payroll count. A self-employed person can technically be employed while earning less, working fewer hours, or barely keeping a business alive.
“Employed” is a large bucket. It contains both a thriving professional with three clients and a desperate freelancer driving for an app between shifts.
The break-even number may be close to zero
In a growing population, the economy normally needs to add jobs every month just to keep the unemployment rate stable. New workers enter the labor market, young adults finish school, immigrants arrive, and people who had stepped away begin looking again.
But when participation is falling, the math changes.
If fewer people are entering or remaining in the labor force, the economy may need to create very few jobs: or potentially lose a small number of jobs: without causing the unemployment rate to rise immediately.
Current estimates put the monthly “break-even” pace of job growth somewhere between a loss of 10,000 jobs and a gain of 30,000 jobs, depending on assumptions about demographics and participation.
That range is not reassuring. It means a weak labor market can look stable simply because the workforce is shrinking around it.
Picture a restaurant with 100 seats. If the restaurant serves fewer customers but also removes 10 seats, management can announce that the percentage of occupied seats has improved. The restaurant is not necessarily healthier. It just has less capacity.
That is the labor market in miniature.
The coming revisions may change the story
The next important date is August 28, when the BLS is scheduled to release the preliminary benchmark revision for payroll employment. The benchmark compares the payroll survey with more complete employer tax-record data from the Quarterly Census of Employment and Wages.
This matters because monthly payroll estimates are based on surveys. They are revised as more information arrives. The annual benchmark is the larger reality check.
One important detail: the August 28 preliminary benchmark will not immediately rewrite the official payroll numbers in the September 4 jobs report. The final benchmark revision is expected later, when the historical payroll series is formally updated.
Still, the preliminary estimate may reveal whether the payroll survey has been overstating or understating employment growth. In plain English, it may tell us whether the jobs picture has been rosier on paper than in employer records.
Then comes September 4, when the BLS releases the August employment report. That report will show whether July was an isolated wobble or part of a broader deterioration.
The numbers worth watching are not just the unemployment rate:
- Did payroll employment recover?
- Did the labor force grow or shrink again?
- Did participation improve?
- Did household employment stabilize?
- Were prior months revised lower?
- Did full-time employment move differently from part-time employment?
A 4.1% unemployment rate paired with another participation decline would be a very different economic message from a 4.1% rate paired with strong hiring and a growing labor force.
What this means for the person looking for work
The national unemployment rate is useful, but it is not a personal forecast.
A worker can face a brutal job market even when unemployment is relatively low. The national figure does not tell you whether jobs are located near your home, whether wages cover rent, whether employers want experience for entry-level positions, or whether a full-time job has quietly become two part-time jobs.
It also does not capture the emotional cost of being rejected repeatedly. Someone who stops applying may disappear from the unemployment statistics while remaining very much unemployed in the practical sense.
That is the central issue with July’s report. The economy did not suddenly become healthier because the denominator got smaller.
A falling unemployment rate is good news when more people are working. It is bad news when fewer people are available, fewer people are participating, and payroll employment is contracting.
The upcoming benchmark revision and September jobs report should help separate statistical fog from economic reality. Until then, treat the 4.1% headline with the same skepticism used when a restaurant claims business is up because it closed half the dining room.
The labor market is not necessarily collapsing. But it is clearly softer than the headline suggests, and working Americans deserve an honest description of the weather before somebody tells them the storm has passed.
Disclosure: Regular Guy Economics is not a financial advisor. This article is for general information and commentary only, and it is not investment advice.
Be mindful, be watchful and good luck.