


If you’ve logged into your brokerage account or checked your 401(k) balance this morning, you’re probably feeling like a financial genius. The S&P 500 just roared back from that Iran war dip, climbing 13% to hit an all-time high of 7,140. On paper, everyone is getting rich. The sun is shining on Wall Street, and the champagne is flowing.
But here at Regular Guy Economics, we don't just look at the scoreboard; we look at the foundation of the stadium. And right now, that foundation is looking a little bit like a Jenga tower in a hurricane.
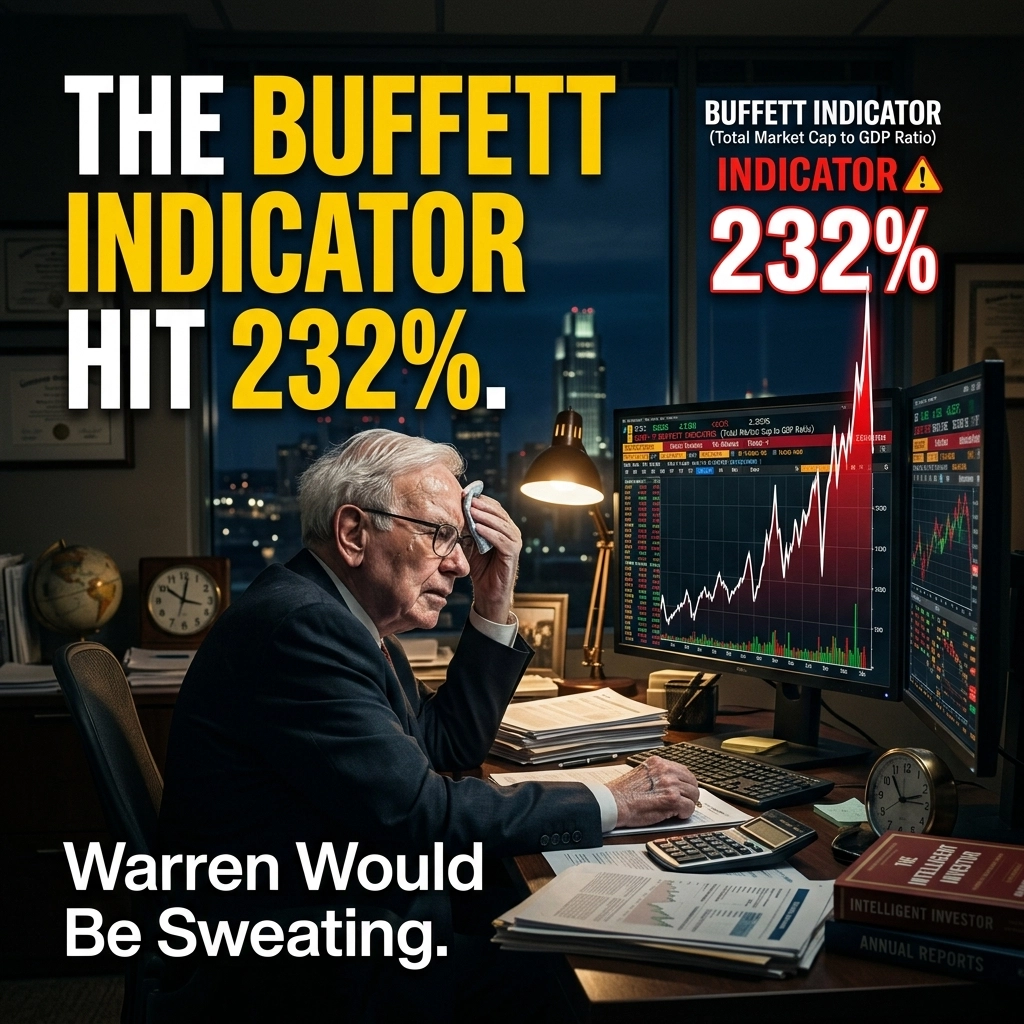
The most famous valuation tool in the world, the "Buffett Indicator", just hit 232%. For context, that’s not just "high." That’s "get your affairs in order" high. If Warren Buffett himself were still actively calling every play, he wouldn’t just be sweating; he’d be looking for the nearest exit.
What is the Buffett Indicator, Anyway?
Before we dive into the wreckage, let’s keep it simple. The Buffett Indicator is just a ratio. You take the total value of the entire U.S. stock market (the market cap) and divide it by the total value of the U.S. economy (the Gross Domestic Product, or GDP).
Think of it like this: If the economy is the house, the stock market is the price tag someone put on the house. Usually, those two things should stay in the same neighborhood. If the house is worth $100,000, but someone is trying to sell it for $232,000 without adding a pool or a second floor, you’d call them crazy.
Well, the "price tag" of the U.S. stock market is now 2.3 times the size of the actual economy.
Historically, the average for this indicator is about 106%. When it gets above 164%, analysts start using words like "Significantly Overvalued." At 232%, we are roughly one-sixth above what Buffett used to call the "prepare-for-a-roasting" zone. We are currently trading at 2.4 standard deviations above the historical trend line. In plain English? We are in uncharted, nosebleed territory.

Why Is the Gap So Massive?
You might be asking, "John, if the economy is struggling and we’re dealing with wars in the Middle East, why are my stocks at 7,140?"
It’s a fair question. The answer lies in a disconnect between Wall Street and Main Street that has become a yawning chasm.
- The AI Mirage: The market is currently pricing in a future where Artificial Intelligence solves every problem from world hunger to the common cold. Investors are betting that AI-driven productivity gains will be so massive that they will magically fix the books.
- Corporate Margin Squeezing: Corporate profits are now sitting at roughly 12% of GDP. Historically, that number hovers around 7-8%. How are they doing it? By keeping your wages sticky while raising prices on everything from eggs to oil. Companies are essentially cannibalizing the consumer to keep the stock price high.
- The "Soft Landing" Narrative: The Fed has convinced everyone that we can bring down inflation without crashing the car. The market is pricing in a perfect scenario where interest rates drop, inflation stays dead, and everyone keeps spending money they don't have.
The problem with pricing in "perfection" is that if anything, even one small thing, goes wrong, the drop is a long way down.
The Profit Margin Trap
Let’s look closer at that 12% corporate profit figure. As a "regular guy," you see this every time you go to the grocery store. You see the price of meat staying high even when the supply chain supposedly "fixed itself." You see "shrinkflation" in your cereal boxes.
When corporate profits are 12% of GDP, it means companies are taking a bigger slice of the pie than they ever have before. But here’s the thing about pies: you can’t keep taking bigger slices forever. Eventually, the consumer (that’s you) runs out of money.
In the past, whenever corporate profits have spiked this far above the 7-8% historical average, they’ve eventually come crashing back down to earth. It’s called "mean reversion," and it’s one of the most powerful forces in economics. You can fight the law of gravity for a while, but eventually, you’re coming down.

The Iran War Dip and the 13% Rebound
Just a few weeks ago, the market took a nasty spill when tensions in the Middle East escalated. Everyone was worried about $150 oil and a global supply chain freeze. But as soon as the headlines cooled off, the market didn't just recover, it exploded.
A 13% rebound off a war-scare low sounds like a victory, but it’s actually a sign of extreme fragility. It shows that the market is "addicted" to the upside. Investors are so afraid of missing the next leg up that they are ignoring the fact that the underlying economy is slowing.
GDP growth for the end of last year was revised down to a measly 0.5%. So, the economy is growing at a snail’s pace, but the stock market is sprinting like Usain Bolt. That’s the definition of a bubble.
What Does the Regular Guy Do With His 401(k)?
This is the part where most "experts" tell you to stay the course and don't worry. And look, I’m not telling you to sell everything and buy gold bars to bury in your backyard. Panic is never a strategy.
But being blind isn't a strategy either. If your 401(k) is 100% in "Aggressive Growth" stocks right now, you are essentially betting that the Buffett Indicator can go to 300% or 400%. You are betting that the laws of math have been permanently suspended.
Here is what a sensible person does when the Buffett Indicator hits 232%:
- Rebalance: If your stocks have grown so much that they now make up 90% of your portfolio, sell some of the winners and move that money into safer stuff (bonds, cash, or short-term treasuries). Lock in those gains while they’re still there.
- Check Your Exposure: Are you heavily invested in the "AI darlings" that have doubled in the last year? Those are the stocks that will fall the hardest when the trend reverses.
- Don't Chase the 7,140: It’s tempting to jump back in when you see the S&P at record highs. "I'm missing out!" you think. No, you’re avoiding a trap. Buying at the all-time high when valuations are at historic extremes is how people lose half their retirement in six months.

Final Thoughts: The Margin of Error is Zero
Warren Buffett famously said that the market-cap-to-GDP ratio is "probably the best single measure of where valuations stand at any given moment." Even if he’s walked that back a bit in recent years, the logic remains sound. You cannot have a stock market that is permanently disconnected from the reality of what the country actually produces.
At 232%, the market is pricing in a future where nothing ever goes wrong again. No more wars, no more inflation, no more supply chain issues, and infinite productivity from robots.
But we live in the real world. We know that things go wrong. We know that the "regular guy" is feeling the pinch of high interest rates and expensive groceries.
When the market is this expensive, the "margin of error" is essentially zero. Any bad news: a disappointing earnings report from a tech giant, a flare-up in the Middle East, or a weird jobs report: could be the pin that pops this 232% balloon.
Enjoy the green on your screen today, but don't let it fool you into thinking the risk has disappeared. The higher we climb, the thinner the air gets.
Be mindful, be watchful and good luck.